News & Changes (November)
Recent changes
- Fix - Some combinations of features used on "Queries" didn't give back any result.
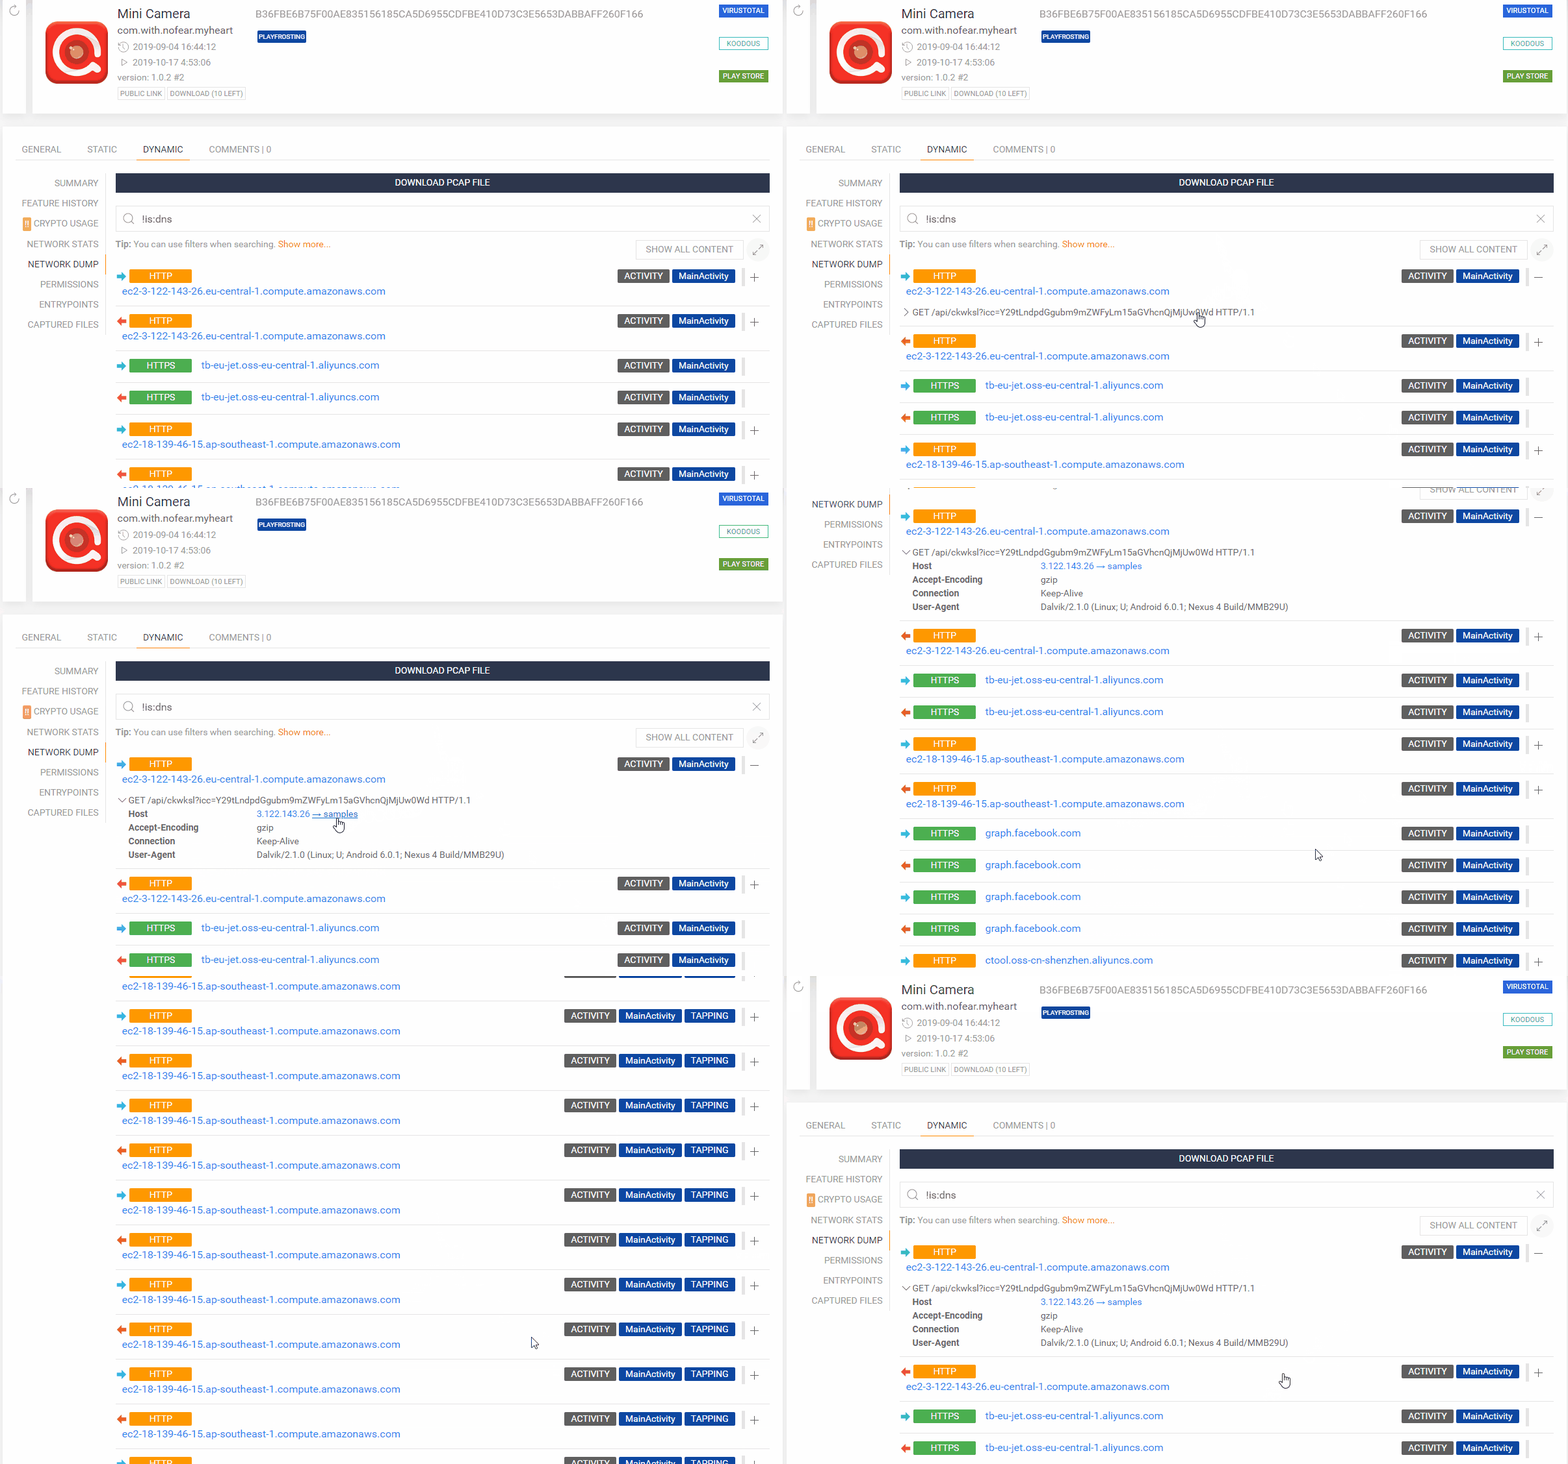
- New - Re-design of the "Network Dump" page.
- Now contains much more contextual information for each packet.
- Which is the activity/receiver/service this packet came from? Find relevant information in the right section of the page.
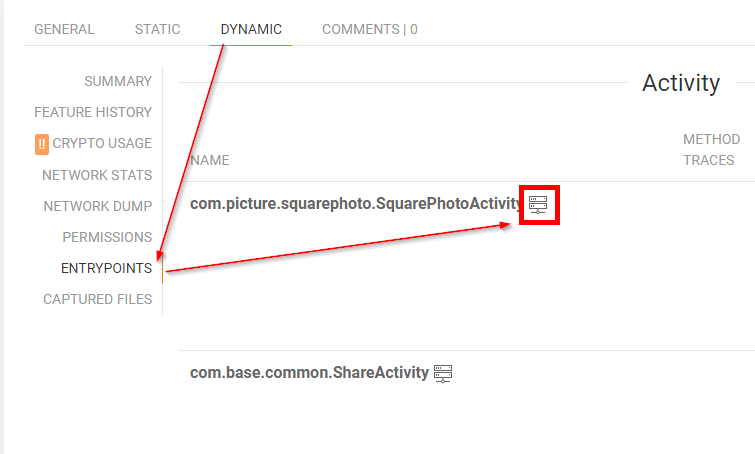
- New - On "Dynamic > Entrypoints" now there's an icon next to each activity/receiver/service that will open the "Network Dump" page and filter only the packets that came from the selected component.
Network Dump Re-design
- Filter packets by activity, receiver, service and other elements
- Correlate samples with domains/IPs

Each activity/receiver/service in "Dynamic>Entrypoints" contains a clickable network dump symbol - only if the selected app component produced some network traffic. Clicking the symbol will open "Network Dump" filtering only the results of the selected component.

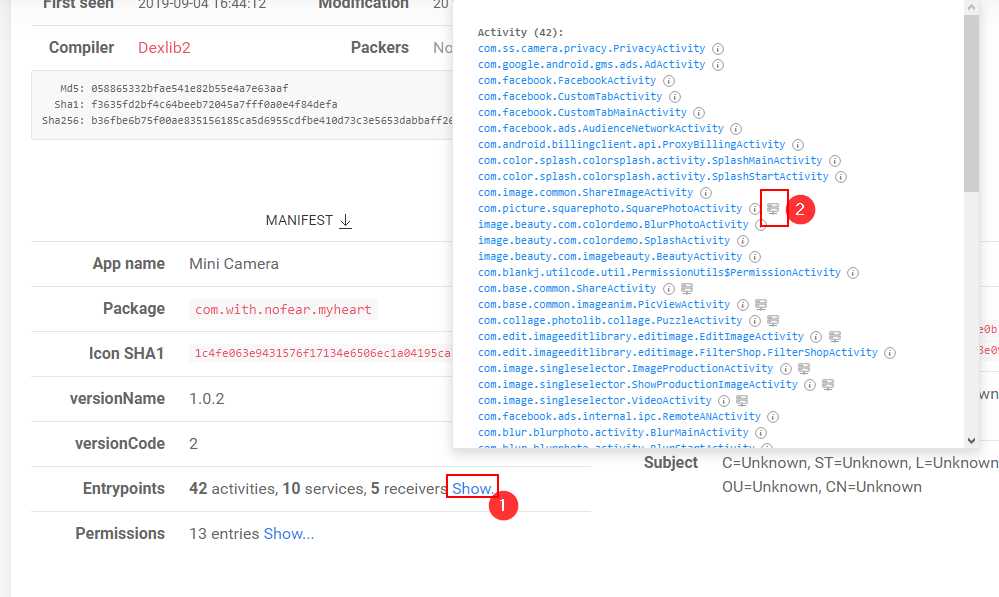
In each sample page, the analyst can now see at the "Entrypoints" (1) which app components produced network traffic (network clickable icon). Clicking on the icon will open the "Network Dump" page where the analyst can browse the network traffic originated only from the selected component.

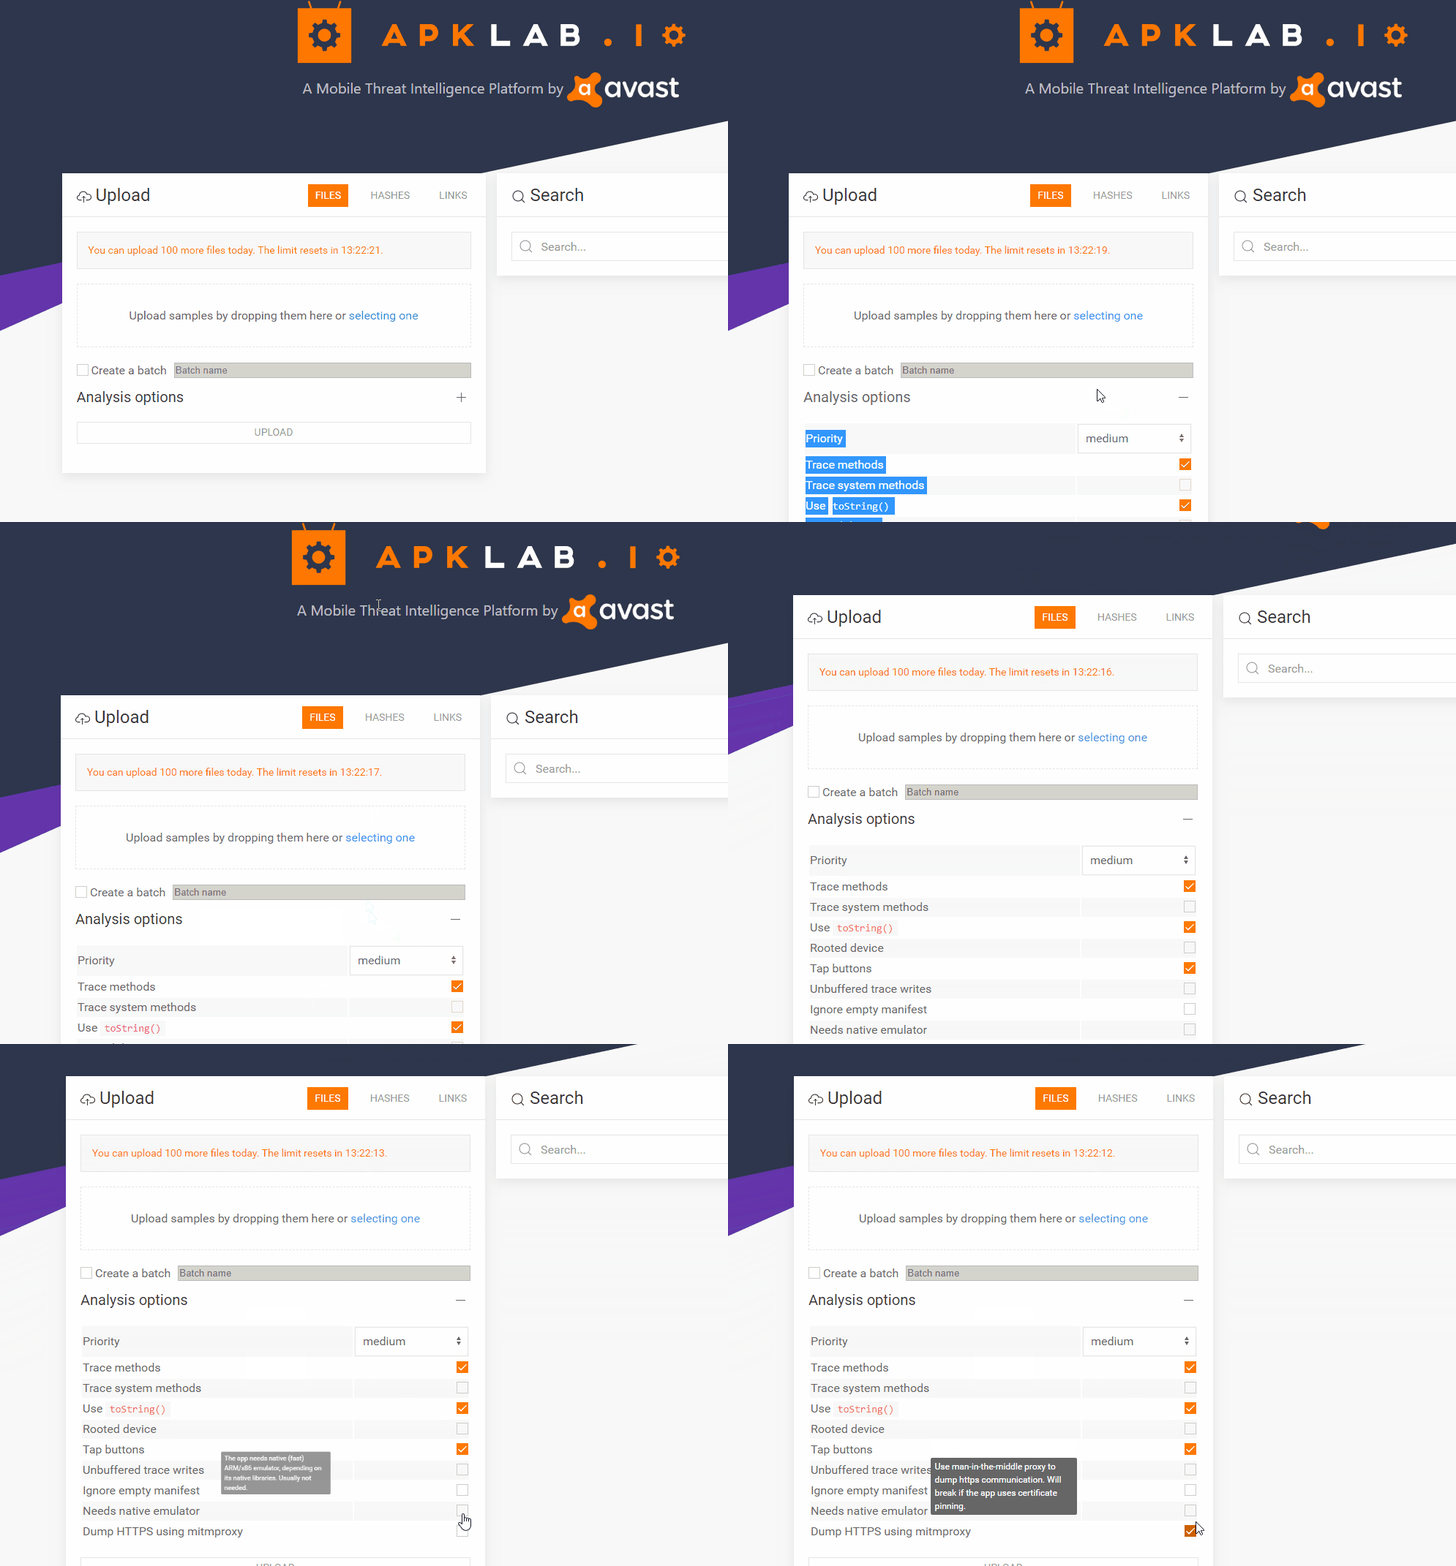
Dump HTTPs
Pretty self-explanatory ;)


